
Interactive Map Maker. Build Custom Maps Online — No Code.
Let visitors drop pins and submit reports on a crowdsourced map, or turn your own data into heatmaps, store locators and choropleth maps — 10 map types, live the moment you create them. No coding required.
Free to start. No credit card required.
10 Map Types: Heatmaps, Choropleth, Store Locators & More
From simple markers to narrative storytelling — pick the right visualization for your data
Collect data from your visitors
Collect crowdsourced location data from your visitors. They drop a pin, fill out your custom form, and you review submissions before they appear on the map.
- Custom multi-step forms
- Submission moderation pipeline
- Abuse protection & CAPTCHA
Draw markers, lines, and polygons directly on your map with an intuitive editing interface. Import an existing file or create from scratch.
- Popups you design: photos, buttons, formats
- Draw polygons and lines
- Multistop routes by address or click
- Satellite, terrain or weather layers underneath — or your own WMS
Group dense markers into clusters that expand on zoom for smooth performance with large datasets.
- Automatic clustering
- Custom cluster styling
- Handle thousands of points
Visualize data density with smooth heat gradients that reveal geographic patterns at a glance.
- Adjustable intensity & radius
- 10 color gradients & a legend
- Optional weight column
Color geographic regions by data values to reveal spatial distributions. Perfect for demographic, economic, and election data.
- Country & region boundaries
- 8 color scales, smooth or in 3–8 classes
- Data-driven styling
Show travel-time reachability zones from any point. Visualize how far someone can travel in 5, 10, or 30 minutes by car, bike, on foot, or by public transit.
- Driving, walking, cycling & transit
- Preset or custom time & distance bands
- Overlay on any base map
Build a searchable location finder with filterable lists, Near Me distance sorting, opening hours, and detail panels.
- Keyword search across your fields
- Custom filter categories
- Near Me or a typed town sorts by distance
Animate data over time with an interactive timeline. Watch patterns emerge as you scrub through dates.
- Temporal data playback
- Adjustable time ranges
- Animation controls
Create narrative-driven maps that guide viewers through locations with scroll-based storytelling. Combine text, images, camera moves and a route between chapters.
- Scroll, click or keyboard navigation
- Chapters with uploaded images
- Routes along roads or straight lines
Hold two datasets against each other on one viewport. Drag a swipe divider across the map, or split the screen in half, and compare before with after.
- Swipe divider or split screen
- Each side has its own data and style
- Each side has its own background layers
- Both maps move together
Everything You Need to Build Great Maps
Bring in your data, make it look the way you want, and publish it anywhere — all from one point-and-click editor.
Map Themes & Custom Styles
Choose from 7 built-in themes or build your own with 45+ color controls, road widths, dash patterns, and fill textures.
Data Import
Upload CSV, Excel, GeoJSON, KML, KMZ, or GPX — or connect a Google Sheet as a live data source that keeps your map in sync.
No-Code Builder
Point-and-click interface — no programming required.
Interaction Settings
Decide what visitors can do — scroll zoom, pan, rotation, and more.
Map Widgets
Toggle the widgets on your map — export, locate me, minimap, fullscreen, scale bar, zoom buttons and more.
Instant Address, Custom Domains
Live at mapji.com/map/your-map the moment you create it. Add a free yourmap.mapji.com subdomain or connect your own domain for a fully branded experience.
Control Every Detail, Without Code
Three panels on the map cover how it looks, what visitors can do with it, and which widgets they see. Every switch saves with the map, so the published page and its embeds match what you set up.
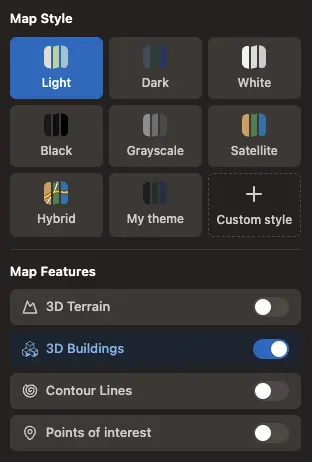
Style
Seven built-in basemaps, any custom style you have saved, and the points-of-interest, 3D terrain, buildings and contour toggles — in one panel on the map.
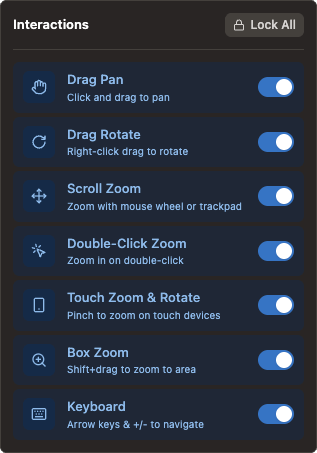
Interactions
Decide what visitors may do with the map. Turn off scroll zoom so an embed stops hijacking the page, or lock everything for a kiosk display.
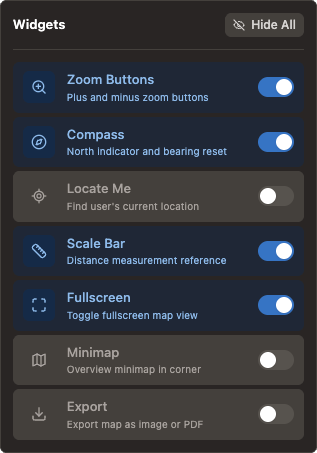
Widgets
Zoom buttons, compass, scale bar, locate me, fullscreen, minimap and an export widget that downloads the current view as PNG, JPG, PDF or SVG.
Built for Serious Cartography
Advanced tools that give you full creative control
3D Terrain & Buildings
Enable 3D terrain with hillshading and extruded buildings for immersive map experiences. Perfect for hiking trails, real estate, and urban planning visualizations.
- Real-world elevation data
- 3D building extrusions
- Adjustable pitch & bearing
Custom Map Styles
Design your own map style from scratch with a full style editor. Tweak 45+ color keys for water, land, roads, and labels, tune road widths and dash patterns, control label halos and text sizes, and add tileable fill textures — all with a live preview updating as you type.
- 45+ color controls with live preview
- Road dashes, widths & casings
- Fill patterns for parks, water & beach
Full UI Customization
Control every aspect of your published map. Toggle navigation widgets, zoom buttons, scale bars, fullscreen mode, and interaction behaviors with simple switches.
- Toggle all map widgets
- Lock interactions for kiosk mode
- Customizable popup content
Satellite, Terrain & Data Layers
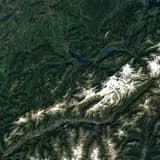
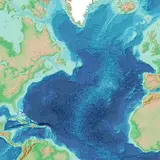
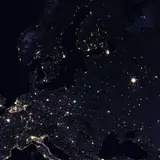
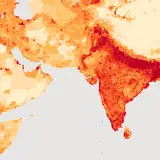
Put real-world context under your data. Add yesterday's satellite view of the planet, hillshade, ocean depth, weather radar, population density or hiking routes from a catalog of open data from NASA, USGS, Copernicus and others — one click each. Or connect your own map service. Layers always sit beneath your markers and labels, on every map type, and stay current because they come straight from the publisher.
- One-click catalog of open data layers
- Your own WMS, WMTS, ArcGIS, TileJSON or PMTiles
- Credits added to the map automatically
Maps for every industry
Real estate, logistics, healthcare, research — explore detailed use cases and map type recommendations for 8 industries.
Explore use cases
Ready to Build Your First Map?
Join creators, businesses, and researchers building beautiful interactive maps. Free to start, no credit card required.
Start Creating