
Documentation
The Mapji manual
A reference for everything in the product: the ten map types and what each one expects from your data, how data gets in and stays current, how a map is styled, and how it is published, embedded and moderated. Sections are linkable — click the beside a heading to copy its address.
How Mapji works
Mapji turns a dataset into an interactive map that lives at its own web address. There is no code to write and nothing to host: you pick a map type, bring your data in, adjust how it looks and behaves, and the map is already live.
Four ideas cover almost everything in the product, and the rest of this manual is organised around them.
| Concept | What it means |
|---|---|
| A map is a site | Each map you create is a self-contained site with its own address, its own data, its own styling and its own settings. Maps never share data or configuration, so changing one cannot affect another. One account can hold as many as you like. |
| Map type | The type decides how your data is drawn and what the editor offers you — clusters, a heat surface, shaded regions, a scrolling story, a submission form. It is chosen when you create the map and can be changed later in Settings. |
| Data source | Where the features come from: a file you upload, shapes you draw, a connected Google Sheet that keeps syncing, or submissions from visitors. A map holds one dataset — except Compare, which holds one per side. |
| The published map | Every map is immediately live at mapji.com/map/your-map, can take a free subdomain or a custom domain, and has a separate embed URL for putting inside someone else's page. |
Everything in the editor saves as you work. There is no publish step and no draft state: an edit is live once it is written, so preview the public map in another tab if you want to watch it change.
What Mapji does not do
Worth knowing before you plan a project around it, because each of these is a design decision rather than a gap waiting to be filled.
- It does not geocode your data. Uploads and Google Sheets are plotted from latitude and longitude in decimal degrees. A column of street addresses will not be converted, so geocode your list elsewhere first. The exceptions each look up one typed place, never your data: the Draw map's route builder (a stop), Story Map's chapter location picker, the Store Locator editor's address box for placing one new location, and a Store Locator's optional town or postcode search, which sorts the list by distance from the place a visitor types.
- It never writes to your Google Sheet. The connection is read-only in the strict sense: Mapji asks Google only for read permission, so the spreadsheet stays the source of truth and cannot be reformatted or emptied by anything here.
- It is not a GIS analysis tool. There is no buffering, intersection or spatial join. Isochrones and road routes are computed for you, but transformations of your own geometry belong upstream.
Quick start
From nothing to a published map is about five minutes, most of it spent choosing how the data should look.
- 1
Sign in
Use a GitHub, Google or Microsoft account. The dashboard lives at
app.mapji.com. - 2
Create a map
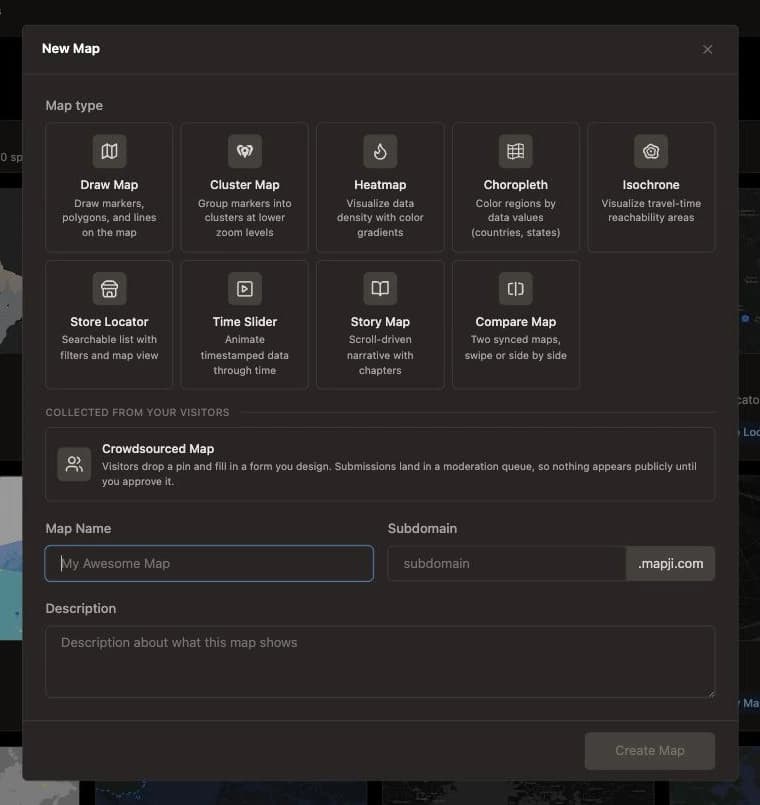
The create dialog asks for a map type first. Nine types are filled with your own data; Crowdsourced Map is listed separately because its data comes from visitors. Then name the map — the web address is slugified from the name as you type, and you can override it.
- 3
Bring your data in
Upload a file, connect a Google Sheet, or build the map by hand on the canvas. See Importing files for what each type expects.
- 4
Configure the type
The Settings tab in the editor sidebar holds the settings specific to your map type: the heat gradient, the cluster bands, the time column, the store fields.
- 5
Style it and set the behaviour
The buttons on the map itself cover the basemap, what visitors are allowed to do with the map, and which widgets appear. Lock an opening view from the status bar under the map if you want it to always start in one place.
- 6
Share it
The map is already live at
mapji.com/map/your-map. Add a subdomain or a custom domain under Settings → Domains, or copy the embed snippet to put it inside an existing page.
Accounts & sign-in
Accounts are created by signing in — there is no separate registration step and no password to manage. Three providers are supported: GitHub, Google and Microsoft Entra ID (work or school accounts).
Which one you choose matters in exactly one place. Google Sheets live sync reads the sheet as you, so it needs a Google connection — signing in with Google grants Mapji read-only access to spreadsheets and an offline token so the background sync can keep running when you are not at the keyboard. Signed in with GitHub or Microsoft, every other feature works normally; only Sheets sync is unavailable.
app.mapji.com for editing, mapji.com/map/your-map (or your subdomain or custom domain) for the live map. Visitors never need an account; published maps are public.Editor layout
Every map type uses the same editor shell, so the same things are always in the same place. Only the contents change.
| Area | What lives there |
|---|---|
| The map | The working canvas, and a live preview of what visitors see. Style and behaviour changes apply here immediately. |
| Buttons on the map | Top left of the canvas: Style (basemap, points of interest, terrain, 3D buildings, contours), Interactions (what visitors can do with the map), Widgets (which on-map widgets appear), and on Draw and Compare a Layers button for background services. A map type that has no use for a popover simply does not show it. |
| Sidebar | A tabbed panel beside the map: a list of what is on the map, and the settings for this map type. |
| Status bar | A thin strip under the map showing where the camera is, with the opening-view lock. |
| Header | The map name, a link to the live site, and — on the data-driven types — the Import button and the Google Sheets connection. |
Sidebar tabs by map type
Most types get a Features list and a Settings tab. Types with a richer editing surface replace or extend them.
| Map type | Tabs |
|---|---|
| Draw, Cluster, Heatmap, Time Slider | Features · Settings |
| Isochrone | Markers (n/5) · Settings |
| Choropleth | Selected areas (n) · Settings |
| Story Map | Chapters · Settings |
| Store Locator | Locations (n) · Settings |
| Crowdsourced Map | Pins · Area · Fields · Rules · Display |
| Compare | Per-side editors, one for each half |
The Features list is read-only and built for finding things: it has a filter box, and clicking a row flies the map to that feature. It stops at 200 rows, so on a large dataset use the filter rather than scrolling. Crowdsourced Map's Pins tab is the exception: it lists submissions rather than features, and is where you moderate them — see Visitor submissions. Settings that belong to the site rather than to the data — search, the opening view — stay available before you have imported anything; type-specific sections show as disabled until there is data to configure.
Status bar
The strip under an editable map is a readout of the current camera. It updates as you pan and zoom.
| Readout | Detail |
|---|---|
| Centre | Latitude and longitude of the middle of the viewport. Click to copy. |
| Zoom | Current zoom level to two decimals. |
| Radius | Ground distance from the centre to the edge of the viewport — a quick sense of scale. |
| Bounding box | The visible extent, on wider screens only. Click to copy, which is the fastest way to grab a bbox for another tool. |
| Lock | Pins the current camera as the map's opening view. See below. |
Opening view
By default a map opens fitted to its data — whatever you have imported decides the starting camera. That is usually right, and occasionally exactly wrong: a national dataset with one outlier opens zoomed out to nothing, and a map built to show one neighbourhood should not re-frame itself every time the data changes.
Locking the opening view pins the camera. Press the lock in the status bar and the map captures where you are standing right now — centre, zoom, bearing and pitch. From then on the editor, the public map and the embed all open exactly there.
| Field | Range |
|---|---|
| Latitude / longitude | Decimal degrees, typed directly |
| Zoom | 0 – 24 |
| Bearing | −180° – 180° (rotation, 0 is north up) |
| Pitch | 0° – 85° (tilt, 0 is straight down) |
Fine-tune the numbers under Opening view in the Settings tab, where each has an input and a slider, and bearing and pitch share a dial preview. On a Crowdsourced Map the same settings live in the Display tab.
Story Map is the exception and has no lock. Its chapters own the camera, so a fixed opening view would be overwritten by the first scroll. It still shows the readouts.
Choosing a type
Ten types, each built around a different question about your data. The fastest way to choose is to ask what the reader should take away: individual places, density, regional comparison, reachability, change over time, or a narrative.
| Type | Expects | Sheets sync | Search panel |
|---|---|---|---|
| Draw | Anything — you draw it or import it | No | Yes |
| Cluster | Many points | Yes | Yes |
| Heatmap | Many points, optionally weighted | Yes | Yes |
| Choropleth | One value per region | Yes | Yes |
| Isochrone | Up to 5 starting points | No | Yes (starting points) |
| Store Locator | Points with attributes | Yes | Built-in sidebar |
| Time Slider | Features with a time column | Yes | Yes |
| Story Map | Places plus written chapters | No | No |
| Crowdsourced Map | Nothing — visitors supply it | No | Yes |
| Compare | Two datasets, one per side | No | No |
You can change type later from Settings → General, and your imported features are kept. What does not carry across is the type-specific configuration, because it describes a different rendering: a heat gradient means nothing to a store locator. Draw is the one to be careful with — its features are stored where a Cluster or Heatmap import writes, so switching a Draw map to one of those and then importing replaces the drawing.
Draw
A blank canvas for maps you build by hand: markers on the places that matter, a shaded catchment area, a traced boundary, a route between stops. It is the right choice when the map is the data rather than a rendering of a table.
Tools
| Tool | What it does |
|---|---|
| Add → Marker | Drops a pin where you click. Opens a picker first: 17 pin and badge shapes, 15 preset colours or any custom colour. |
| Add → Icon | A marker rendered as an icon instead of a pin, from the Maki or Lucide icon libraries, in any colour and size. |
| Add → Image | Places an uploaded image on the map as a marker — a logo, a floor plan pin, a photo. |
| Add → Route | Builds a multistop route that follows real roads. See below. |
| Add → Line, Area, Rectangle, Circle, Freehand | Draws a shape: click its points, two opposite corners, or a centre and then the radius. A finished shape opens its properties. Click a shape to select it, then drag its points to reshape it, or drag the shape itself to move it. |
| Import / Export | Import merges a file into what is already on the canvas — it never replaces it. Export downloads everything as GeoJSON. |
Click any feature to open its properties: a name, a description and a colour. On the published map, clicking a marker, line or shape opens a popup with its name and description, shown as plain text — links, images and formatting are not rendered. Lines list their measured length in the sidebar's feature list. Icon markers can have their icon and size changed after the fact from the properties panel.
Routes
A route is drawn along the real road network, not as a straight line between points. Add → Route opens a panel beside the map, and the map stays live: click it to add a stop, click one of your own markers to route through it, or search an address. The route is recalculated as you go, with each leg's distance and time in the stop list. Drag a pin to move a stop, drag the list into a new order, or click a stop's name to search for a different place.
| Setting | Detail |
|---|---|
| Stops | 2 – 10 per route |
| Travel modes | Driving (car, truck, bus, motorcycle, scooter), cycling (bicycle, mountain bike, road bike), on foot (walk, hike). No public transit. |
| Stop order | Reverse the list, or Optimize to find the shortest order — the first and last stops stay put (on a round trip, only the start). |
| Options | Return to the start (round trip); avoid tolls, highways or ferries where there is another way (driving modes); the route's colour. |
| Climb | Walking and cycling routes show total ascent and descent and an elevation profile. |
| Stop markers | A numbered badge by default; switch any stop to a Maki or Lucide icon, and back again. Stops placed by clicking are named after the street they land on. |
| Editing | Reopen a route from its row in the feature list or its properties panel to change stops, mode or options. A name or description you wrote is kept. |
| What gets saved | One line for the path plus one point per stop, as ordinary features. They export, restyle and delete like anything else you drew. |
| Deleting | Deleting the route line removes its stop markers too. Deleting a single stop leaves the rest of the route alone. |
The route's distance and duration are stored on the line and shown in the feature list, where its stops are listed under it. Visitors who click the route see its travel mode, distance, time and number of stops.
Full Draw Map guideCluster
Thousands of overlapping pins tell you nothing. A cluster map groups nearby points into a single numbered circle that splits apart as you zoom in, so the shape of the dataset is readable at every scale. Click a cluster to zoom to its contents.
It expects points. Lines and polygons are reduced to a representative point when the map is drawn, so a mixed file still renders — but if your data is mostly areas, a choropleth will say more.
| Setting | Range / default |
|---|---|
| Cluster radius | 20 – 200 px (default 80). Larger means fewer, bigger clusters. |
| Break apart at zoom | 0 – 22 (default 14). Past this zoom every point is drawn individually. |
| Cluster Colors | Two thresholds — Medium starts at 10 and Large starts at 50 by default — and a colour for each of the three sizes. They drive the circle size and colour steps. |
| Spread out overlapping points | Off by default. On, clicking a cluster fans its points out around it instead of zooming in, so points that share one spot can each be clicked. |
| Donut Chart Clusters | Draws each cluster as a ring split by category instead of a solid circle, with a legend. |
Donut chart clusters
Pick a property to group by, then define the categories. Each is matched either by Exact values (one or more values from that column) or by a Number range — From one value Up to (not including) another. Anything that matches nothing is drawn in a separate uncategorised colour, which is also a quick way to spot dirty data. The result is a cluster that shows composition, not just count — how many of these incidents were severe, how many of these stores are franchises.
A legend on the map lists each category with its colour. Give it a title of your own so readers know what the rings are counting.
Full Cluster Map guideHeatmap
A heatmap answers “where is this concentrated?” It blurs individual points into a continuous density surface, which makes patterns obvious and individual records unreadable — that is the trade, and it is the reason a heatmap is a poor choice for data someone needs to look things up in.
Points contribute equally by default. Set a weight column and each point contributes in proportion to that number instead, which is what you want for sales figures or population, and what you do not want for raw events where every record already counts once.
| Setting | Range / default |
|---|---|
| Color Gradient | 10 presets, Magma by default — a perceptually even ramp that reads better than the classic rainbow. Also included: Blue → Red, Green → Yellow → Red, Purple → Orange, Cyan → Magenta, Fire, Teal → Yellow, and blue, green and grey monochromes. |
| Intensity | 0.5 – 3.0 (default 1). How hot a given density burns. |
| Radius | 5 – 50 px (default 20). How far each point's influence spreads. |
| Opacity | 0.1 – 1 (default 1). |
| Weight by | Any numeric column, optional. Unset means every point counts once. |
| Legend | A Low → High key on the map, under a title you write. |
Choropleth
Regions shaded by a value: unemployment by county, turnout by constituency, revenue by country. You do not need boundary files — Mapji ships the geometry and you supply the numbers. In the app this type is listed as Region Map.
Picking the areas
The area picker is a single search box over a catalog of basemaps. Start with the whole world or a continent, or search for a country and pick the level you want inside it. Choose an entry and you land on a checkbox grid of its regions, so you can take all of them or just a subset.
| Level | Coverage |
|---|---|
| Countries | Every country, from the geoBoundaries open dataset (ADM0). |
| States / provinces | First-level subdivisions wherever geoBoundaries publishes them (ADM1). |
| Counties / districts | Second-level subdivisions where available (ADM2). |
| NUTS 1 / 2 / 3 | The European statistical regions, from Eurostat — the levels most EU data is published against. |
| Your own boundaries | Upload a GeoJSON, TopoJSON, KML, KMZ, GPX or zipped Shapefile and nominate the property that names each region. Use this for sales territories, school catchments, delivery zones — anything with no official code. |
Areas appear immediately, grey until they have data, and you can come back and add more at any time without disturbing the values already entered.
Attaching values
Upload a CSV or Excel file with a region column and a value column, connect a Google Sheet to keep the values live, or type them straight into the table in the sidebar. The join tries the region name first, then the official code (ISO 3166-2 or the NUTS code), then the country, then an internal identifier, then a partial name match — so “Bavaria”, “Bayern” and DE-BY all find the same region. Anything that fails to match is listed before you commit, so a typo is visible rather than silently absent.
| Setting | Detail |
|---|---|
| Colour scales | 8 presets — 5 sequential (blues, greens, reds, oranges, purples) for low-to-high, and 3 diverging (red–blue, red–green, brown–teal) for data with a meaningful midpoint. |
| Colour steps | Smooth (the default): the lowest value takes the first colour, the highest the last, and everything between sits on a continuous gradient. Quantiles: 3–8 classes holding about the same number of regions each. Equal intervals: 3–8 classes covering equal slices of the value range. Custom breaks: you type the values where the colour changes. Quantile and equal classes are recalculated from your values, so they follow a re-import. |
| Value format | Automatic, or a number, percent (25 reads as 25%) or currency with a fixed number of decimals — used in the legend, the hover tooltip and the popup. |
| Legend | A gradient bar from the minimum to the maximum — or one swatch per class with its range — plus a swatch for regions with no data, under a title you write. It is a key to read the map by, not a filter. |
| Tooltip | Visitors hover a region to see its name and value. |
| Editing | Values can be corrected inline, and individual regions removed, without re-uploading. |
Isochrone
An isochrone shades everywhere you can reach from a point within a given time or distance, following the real network rather than drawing a circle. “Fifteen minutes’ walk” is a far more useful catchment than “one kilometre”, and the two look nothing alike once rivers and motorways are involved. In the app this type is listed as Travel Time Map.
| Setting | Options |
|---|---|
| Starting points | Up to 5, each nameable and given its own icon |
| Travel modes | Walk, bike, car, transit |
| Time bands | 5, 10, 15, 30, 45 and 60 minutes as presets, or type your own — 20 minutes, say |
| Distance bands | 500 m, 1 km, 2 km, 5 km and 10 km as presets, or type your own |
| Time or distance | One or the other, with as many bands as you like |
| Points of interest | The basemap's schools, stations, parks and other places, switched on or off from the Style menu, so the zones read against real destinations |
Place starting points by clicking the map, or import a point file and tick the rows that should become starting points — up to five. Bands are drawn as nested translucent polygons, colour-coded from nearest to furthest, over any basemap, and a legend lists each band with its colour. The zones show how far people can get, not how many of them live inside — Mapji does not count population or addresses within a band.
Store Locator
A searchable directory with a map attached: a scrollable list of locations beside the map, filters down the side, and a detail panel for each one. This is the type to reach for when the visitor has a task — find the nearest branch, find one that is open now, find one that does the thing they need.
Search and filters
Free-text search covers every field on every location, so a visitor can type a city, a postcode already in your data, a manager's name or a service. Every word has to match, in any field, and accents are ignored — “pharmacy leeds” finds the Leeds pharmacy, “cacak” finds Čačak. It is a keyword match, not an address lookup: a postcode only finds locations that carry it in their data. Turn on town or postcode search (off by default) and pressing Enter looks the typed text up as a place instead — the list then sorts by distance from it, nearest first, under a “Nearest to …” chip. Your locations still need coordinates: only the visitor's one typed place is looked up, near your locations, and it isn't stored. Near Me, below, answers “nearest to me”. On top of that you define faceted filters from your own columns:
- Select — a column with up to 10 values, shown as a row of toggle pills (pick one or several).
- Multi-select — up to 30 values, also as toggle pills, and a comma-separated cell counts as belonging to each of its values, which is what makes a “services offered” column work properly.
- Range — a numeric slider, decimals included.
- Open now — offered to visitors automatically once a working-hours column is set, narrowing the list to locations open at that moment.
Filter choices are read from your current data, so a category that arrives with the next sync or import appears on its own. Turn on Zoom to results (off by default) and the map fits itself to the matching locations once a visitor searches or filters.
Any one filter can also drive the map: nominate it and each of its options gets its own marker icon, in any colour, so branches, kiosks and warehouses are distinguishable at a glance without opening anything — and a legend of those icons can sit on the map. Markers can be the bare icon, the icon on a white badge, a dot, or a pin with the icon inside.
Cards and detail
| Setting | Detail |
|---|---|
| Display fields | Title, subtitle, description and image, each mapped to one of your columns |
| Extra fields | Up to 5 more, typed as text, phone, email or URL so they render as the right kind of link |
| Working hours | Point at an hours column — plain text, structured JSON, or let Mapji work it out — to put a status line such as “Open · Closes 17:00” on every card and in the detail panel, and an Open now filter in the sidebar. Hours past midnight work; optionally set the store's time zone, a 12-hour clock and “Closes soon”. |
| Other columns | Every column you didn't map is listed in the detail panel, with true/false shown as Yes/No. Link contacts (off by default) turns the emails, websites and phone numbers among them into links. |
| Quick actions | Call, Website and Email buttons under the title in the detail panel, from your phone, email and URL fields or from columns named like them. Off by default. |
| Share links | Copy link in the detail panel copies a link that opens the map on that location with its details showing. A location is recognised by its position plus its id or name column. The link carries the map's address and nothing else, so an embed's access token never travels with it. Off by default. |
| Hidden columns | Columns you hide are removed before the page is sent: they are not in the page source, the panel or the search. Columns the panel uses (title, filters, opening hours…) can't be hidden. |
| Featured | Pick a column whose yes, true, 1, x or ✓ cells mark a location featured — or star locations in the Locations tab, which fills that column in. Featured locations get an accent edge, a Featured badge and a larger marker, and can be pinned to the top of the list (except while it is sorted by distance). |
| Near Me | A geolocation button that sorts the list by distance from the visitor and shows the distance on every card. Off by default. |
| Town or postcode search | Pressing Enter in the search box looks the text up as a place near your locations — several matches are offered to pick from — selects the nearest location and sorts the list by distance from that place. Off by default; up to 300 searches a day per map. |
| Distances | Kilometres (the default) or miles. Optionally a dot on the map where the visitor is or the place they searched, and a distance filter (“Within 10 km”) with the choices and starting distance you pick — both off by default. |
| Directions | A button on every location that opens directions in Google Maps — or Apple Maps on an iPhone or iPad. Filled or outlined, optionally labelled on cards, and it can route to an address column instead of the pin. |
| Selecting a location | Clicking a card or marker opens its details in the panel (on a phone, the drawer opens) and enlarges its marker — or lights a halo behind it, or neither. Optionally the details also appear in a popup on the map, in the panel's colours and with the location's photo on top. |
| Clustering | Groups nearby markers on the map. On by default, in your accent colour or one of your own, with an adjustable radius and the zoom from which every marker shows. A selected location always zooms in far enough to leave its cluster. |
| Layout | Panel on the left or right, 280 – 600 px wide (or drag its edge in the editor); a header with your logo, title and subtitle; which parts each card shows; whether the location count shows on the map; and whether the list starts open or collapsed on phones. A Phone preview in the editor shows the map at phone width without changing anything. |
| Appearance | Light, Dark, Brand (from your accent) and Minimal themes as a starting point; accent, background, card, text, muted text and border colours; font; title size; corners; card style (flat, elevated, bordered or glass); and compact mode. Text on your accent switches to black when the accent is too light for white. |
Adding and editing locations
Besides importing, you can manage locations one at a time in the editor. Add location in the sidebar's Locations tab (or, on an empty map, in the panel), then click the map — or type the address in the box that appears and pick it: a form opens with the fields your locator displays — title, subtitle, description, image, contact fields, opening hours and filter columns — and the orange pin can be dragged into place before you add it. Escape stops placing, or closes the form (asking first if you typed anything). The address box only places this one pin; it never reads addresses from your data. To change a location, open it in the sidebar and choose Edit location: edit any field, add a new one, clear one to remove it, or Move pin. Delete sits next to it and asks first. Edits are saved straight away, like adding and deleting. Clearing all data removes every location but keeps your Store Locator settings.
When a Google Sheet is connected, the sheet owns the locations — the next sync rebuilds them from it — so adding, editing and deleting on the map are switched off. Change the sheet instead.
Time Slider
A timeline under the map that steps through your data one period at a time, with play, pause and scrub. Use it when when is as much of the story as where — an outbreak spreading, a chain opening branches, a fleet moving through a day.
It needs one column holding the time. Mapji tries to detect it on import; confirm or change it in Settings, along with how the values should be read.
| Setting | Options |
|---|---|
| How to read it | Date (an ISO date such as YYYY-MM-DD), Unix timestamp (seconds since 1970), or As written — shown exactly as it appears, which suits labels like quarters or era names |
| Label format | An optional pattern for how each step is written — YYYY, MMM, MMMM, DD, HH, mm, with literal text in [brackets] |
| Steps | Each value (one step per distinct value), Calendar — hourly, daily, weekly, monthly, quarterly or yearly periods — or Equal steps, a fixed number of equal-width bins |
| What's on screen | Current (just the current step), Build up (everything up to it), or Rolling (a window of the last few steps — Steps in view sets how many) |
| Faded to / Fades over | With Build up or Rolling, earlier steps stay on the map behind the current one and fade to the Faded to opacity over the Fades over number of steps, so age reads as distance from the cursor |
| Seconds per step | 0.25s, 0.5s, 1s, 2s, 3s or 5s |
| Loop | Restart from the beginning when the timeline ends |
| Cross-fade | Fade features in and out across a step instead of cutting between them |
| Markers | Circles in any colour and size, or a Maki or Lucide icon; either can take its colour — and an icon its glyph — from a category column, and its size from a number column |
| Density bars | A bar per step behind the slider showing how many features fall in it |
| Legend | Lists each value of the category column on the map, under the column's name or a title you write |
| Popup | Choose which properties a marker shows when clicked |
| Timeline panel | A title of your own, and Start collapsed so the map is not covered on load |
Story Map
Long-form writing beside a map that moves as the reader scrolls. Each chapter has its own text and its own camera; crossing into a chapter moves the map to that place. It is the format for a journey, an investigation, a field report, a guided tour.
Write chapters by hand, or import a point file to get one chapter per feature and edit from there. Chapter text is Markdown, so headings, links, emphasis and lists all work. Images are uploaded straight from the chapter editor — the button, a paste or a drop — as PNG, JPEG, GIF or WebP up to 10 MB; large photos are scaled down first. A Write / Preview toggle shows the chapter as readers will see it.
| Per chapter | Options |
|---|---|
| Camera | Centre, zoom, bearing 0 – 360°, pitch 0 – 85°, and a fly time (2 seconds by default). Frame it with the sliders, or move the map yourself with Set view on map |
| Movement | Glide (the default), Fly — out and back in along an arc — or Jump, a cut. Optionally a slow orbit around the place once the camera arrives |
| Marker | None, a dot, the chapter number, or a Maki or Lucide icon, in any colour. The badge beside the chapter title follows it |
| Text animation | Seven presets — none, fade, slide up, slide left, scale in, blur in, spring — with an optional delay |
| Route to next | When the story has a route: follow it, always a straight line, or no line to the next chapter |
| Whole story | Options |
|---|---|
| Theme | Light, Dark, Glass (white text on a dark translucent panel) or Minimal — the look of the text panel |
| Accent Color | Eight presets or any colour you pick |
| Font | Default, Inter, Serif or Monospace |
| Layout | Map on the left or the right (always on top on phones), title size, card style — flat, bordered or elevated — corner radius, and compact spacing |
| Route | Off, straight lines between the chapters, or along roads by car, bike or on foot — in any colour and width, solid or dashed, optionally bold up to the current chapter and faint after it |
| Progress Indicator | On or off, at the map's outer or inner edge, with previous and next buttons |
| Center crosshair | Off by default; six styles — cross, dot, reticle, target, frame, pin — in any color, 32–160 px, at any opacity |
Readers can scroll, click a marker or a progress dot, or use the keyboard: ↓ → Page Down or j for the next chapter, ↑ ← Page Up or k for the previous one, Home and End for the first and last. Every chapter has its own link — add #chapter-3 to the map's address to open the story at chapter 3, and the address follows the reader as they go. For readers who ask their device for reduced motion, camera moves become cuts and text no longer slides or scales in.
Crowdsourced Map
The one type you do not supply data for. Visitors drop a pin, fill in a form you designed, and their submission arrives in a moderation queue — the editor's Pins tab. Approve it and the pin joins the public map. Community reporting, field surveys, directories, contests, citizen science.
1. Define where pins may go
| Area mode | Behaviour |
|---|---|
| Global | Anywhere on Earth |
| Region | One or more countries, states, counties or NUTS regions, picked by name |
| Bounding box | A rectangle, drawn on the map or typed as coordinates |
| Polygon | Any shape you draw — a city limit, a park, a catchment |
Whatever you choose is rendered as a spotlight: everything outside the area is dimmed and the allowed region is a clear window, so visitors can see where they are allowed to contribute before they try.
Region searches the same boundary catalog the choropleth map uses — geoBoundaries for countries, states and counties worldwide, and Eurostat NUTS levels across Europe. Pick “Serbia”, or three counties in Germany, and pins are held to the real administrative border rather than a box you eyeball. The boundary is simplified for display, so a pin within a few hundred metres of the border may fall on either side; draw a polygon when you need an exact line.
2. Build the form
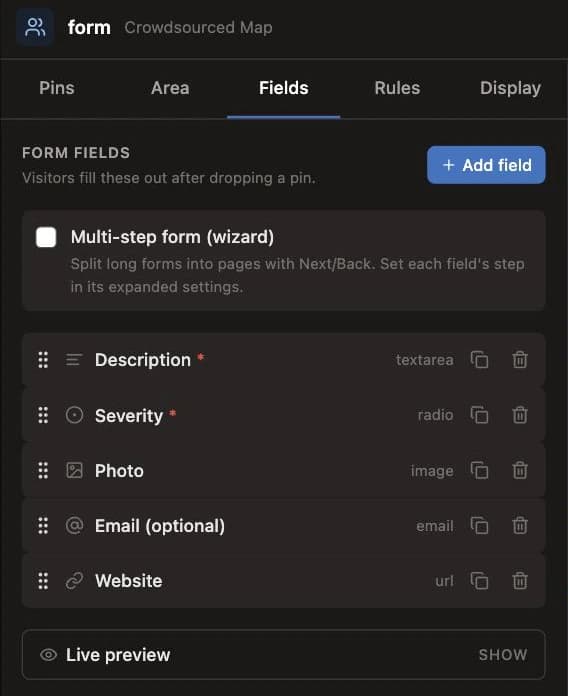
Fourteen field types: Short text, Long text, Number, Email, URL, Date, Time, Phone, Rating, Dropdown, Radio, Multi-select, Checkbox and Image. Six starter templates — report a pothole, business listing, photo contest, event submission, site review, sighting log — give you a working form to adapt. A live preview shows exactly what visitors will see as you build.
- Validation per field — required, minimum and maximum, maximum length, a regular expression, and how many options a Multi-select accepts.
- Conditional fields — show a field only when another one equals, does not equal, has any value, or is empty.
- Multi-step forms — assign fields to steps and visitors get a wizard with a progress bar instead of one long page.
3. Set the rules
| Setting | Default |
|---|---|
| Open for submissions | Open. Turn it off, or set a closing date and time, and the form stops accepting entries with a message you write. Approved pins stay on the map either way — closing stops new submissions, it does not take the map down. |
| Auto-approve | Off. On, submissions skip the queue and appear immediately — worth turning on only once you have watched the abuse defences hold. |
| Rate limit | 5 submissions per hour and 20 per day, per visitor |
| Image uploads | Allowed, 1 attachment per submission (up to 5), 5 MB each. JPEG, PNG and WebP only, verified by inspecting the file itself rather than trusting what it claims to be. |
| Honeypot | On. An invisible field with a name unique to your map that bots fill in and humans never see. |
| CAPTCHA | Off. Cloudflare Turnstile can be switched on when a campaign attracts attention. |
| Allowed origins | Unrestricted. Set a list and the form only accepts submissions from pages you name, which is how you lock an embed to your own site. |
4. Emails and webhooks
- You get an email when a submission needs review — and optionally for auto-approved ones too. It links straight to that submission, opened in the map editor. Send them somewhere other than your account address if you like.
- Visitors can be emailed a confirmation when they submit and a notice when their submission is approved or rejected — both off by default, and both only possible if your form collects an email address.
- Webhooks post JSON to your endpoint on any combination of four events: created, approved, rejected, marked spam. Each request carries an
X-Mapji-Signatureheader — an HMAC of the body using your shared secret — so your receiver can prove it came from Mapji. Failures are retried, and the last deliveries are listed in the editor so you can see what your endpoint actually returned.
5. Choose what the public sees
| Setting | Options |
|---|---|
| Public visibility | Hidden (nobody sees approved pins), pins only, or pins with a details popup |
| Pin rendering | Clustered (default), heatmap, or every pin drawn plainly |
| Field mapping | Which fields become the pin's title, description, image, colour and value |
| Public fields | An allowlist. Only mapped fields and fields you tick here are ever published — everything else stays in the dashboard, which is how you collect a phone number without publishing it. |
| Feedback | The success message, or a URL to redirect to after submitting |
Compare
Two maps of the same place, locked to the same camera, so a reader can hold one dataset against another. Before and after, plan and reality, two years, two scenarios.
| Setting | Options |
|---|---|
| Layout | Swipe — both maps full-bleed with a draggable divider revealing one under the other — or Side by side, two half-panes |
| Divide | Left / right or top / bottom |
| Keep the two maps in sync | Always on in Swipe (the maps overlap, so they must agree). Optional in Side by side, if you want the halves to move independently. |
| Labels | A caption per side, shown over the map |
Each side is configured independently and holds its own dataset, imported from its own button in the sidebar.
| Per side | Options |
|---|---|
| Display as | Shapes (the raw geometry, with fill, line and circle styling), Heatmap, Cluster, or Isochrone from a single origin |
| Basemap | Same as the map's own style, any of the seven built-in themes, or one of your saved map styles |
| Background layers | Its own list, independent of the other half |
| Colours | Its own accent, used consistently across every mode |
Importing files
One import pipeline serves every map type. It reads the file server-side, normalises it to WGS84 and hands it to whichever type you are working in — so a Shapefile and a KML behave identically once they are in.
| Format | Extensions |
|---|---|
| GeoJSON / TopoJSON | .geojson .json .topojson |
| Shapefile | .zip containing at least .shp, .shx, .dbf and .prj — reprojected for you |
| Google Earth | .kml .kmz |
| GPS tracks | .gpx |
| Spreadsheets | .csv .xlsx .xls with latitude and longitude columns |
Every one of these works on every map type that imports at all — which is all of them except Crowdsourced Map, whose data comes from visitors.
Where the Import button is
Most types import from the Import button in the editor header. Four import from their own surface instead, because each needs to know something the generic dialog does not:
| Map type | Where |
|---|---|
| Cluster, Heatmap, Choropleth, Store Locator, Time Slider | The Import button in the editor header |
| Draw | Import in the drawing toolbar — merges into the canvas |
| Story Map | The chapter builder — one chapter per feature |
| Isochrone | Import from file in the editor — tick the rows to use as starting points, up to 5 |
| Compare | The per-side button in the sidebar |
Spreadsheets
A spreadsheet is converted in your browser, so you see a preview of the columns before anything is uploaded. Latitude and longitude are detected from common column names; confirm or correct them in the mapping dialog. Every other column is carried onto the features as a property, which is what makes it available later to search, filters, popups, cluster categories and heatmap weights.
52.3676, not 52° 22' 3" N. Rows with a blank or out-of-range coordinate are skipped rather than plotted somewhere wrong.Re-importing
If the map already has data, you are asked whether to replace it or add to it. Draw always merges — it would otherwise delete the drawing you are in the middle of — and Compare always replaces the side you are importing into.
Your appearance settings survive either way. The one thing that does not is configuration that names a column of the old data: if a heatmap's weight column is missing from the new file the weighting is dropped back to unweighted, and if a time slider's time column is gone the slider configuration is cleared and re-detected — a slider pointing at a column that no longer exists renders nothing at all, which is worse than starting over.
Geometry handling
Draw, Cluster, Heatmap, Time Slider, Choropleth and Compare accept any geometry. Store Locator, Story Map and Isochrone are point-based, so lines and polygons are reduced to a representative point on import. Features with no usable coordinates are dropped.
Google Sheets live sync
Instead of uploading a file, connect a Google Sheet and the map follows it. Your team keeps editing the spreadsheet they already use; the map updates itself. This is the right answer whenever the data has an owner who is not the person who built the map.
- 1
Paste the sheet URL
Any spreadsheet your Google account can read. It does not need to be shared publicly.
- 2
Pick the tab
One tab per map. Mapji lists what the workbook contains.
- 3
Map the columns
Latitude and longitude, plus title and description. A time column for a Time Slider, region and value columns for a Choropleth, a weight column for a Heatmap. Optionally pass every remaining column through as feature properties — do this if you plan to search or filter on them.
- 4
Leave it running
Mapji re-checks the sheet about every five minutes and rewrites the map only when the contents have actually changed. There is a Sync Now button for an immediate pull, and a status widget showing the last successful sync and any error.
| Fact | Detail |
|---|---|
| Supported types | Cluster, Heatmap, Choropleth, Store Locator, Time Slider |
| Not supported | Draw, Isochrone, Story Map, Crowdsourced Map, Compare — each has its own data flow |
| Access | Read-only. Mapji requests only the read scope, so it cannot write to, reformat or delete anything in your spreadsheet. |
| Sign-in | Requires a Google connection, since the sheet is read as you |
| Row limit | The first 10,000 mappable rows; the status widget reports how many were skipped |
Visitor submissions
You review what comes in on the Pins tab of the map editor, where its count of pending submissions shows. It lists every submission, whatever its status, beside the live map. While the tab is open the map shows those submissions rather than only the approved pins: each is coloured by its status, and the map follows whatever filter is active. Clicking a row flies the map to its pin; clicking a pin selects and scrolls to its row. The other tabs go back to showing the map as visitors will see it.
| Capability | Detail |
|---|---|
| Moderate | Approve or reject straight from the row, or approve, reject or mark spam in bulk across a selection |
| Filter | By status, by a search over every answer and the visitor's name or email, by whether a photo was attached, and by a date range |
| Inspect | A detail view with every field value, the attached photos, the pin's coordinates and what was recorded about the visitor. Step to the previous or next submission with the arrows (or ← →); moderating one moves on to the next by itself |
| Correct | Edit field values and correct the pin's coordinates, for the submission that got the right information into the wrong place |
| Export | Everything currently filtered, as CSV |
| Deep links | Every submission has its own link, which opens it in the editor — it is what the notification email links to |
Submissions are rendered against the form as it was when they were made. Change your form later and old submissions still display with the questions their author actually answered, rather than being reshaped to fit the current version.
What is recorded about visitors
To make moderation possible, each submission records what the request revealed: IP address, an approximate country, region, city and timezone, the page it was submitted from, and the browser and device. It is used for rate limiting and for judging whether a batch of submissions is genuine.
This is personal data and it is visible only to you, the map's owner. It is never published to the map, never included in the public GeoJSON, and never shown to other visitors. If you collect submissions from the public, say so in your own privacy notice.
Limits
| Limit | Value |
|---|---|
| Features per data source | 10,000 |
| Import file size | 25 MB |
| Google Sheets rows per sync | 10,000 mappable rows |
| Isochrone starting points | 5 per map |
| Route stops | 2 – 10 per route |
| Background layers | 5 per map, or 5 per Compare side; up to 8 source layers from one vector archive |
| Form field types | 14 |
| Submission attachments | Up to 5 per submission, 5 MB each by default |
| Map name | 32 characters |
| Map description | 140 characters in the create dialog |
| Share image / tab icon upload | 10 MB |
| Web address | Letters, numbers and hyphens; a short list of reserved names is unavailable |
Over the feature limit, the usual answers are to aggregate before importing (one row per region rather than per event), to split the dataset across several maps, or to publish it as a background layer, which is fetched live and is not subject to the cap.
Basemap themes
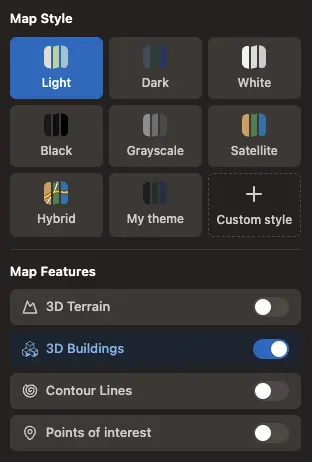
The basemap is what your data sits on. Seven are built in, and switching between them is instant and non-destructive — your data and every setting are untouched. Change it from the Style button on the map.
| Theme | Description |
|---|---|
| Light | A clean, low-contrast vector map. The default, and the safest backdrop for coloured data. |
| Dark | The same map inverted — good for bright markers and heatmaps. |
| White | Near-blank: geometry with almost no fill. Maximum contrast for the data on top. |
| Black | The inverse, for dark presentations and screens. |
| Grayscale | Neutral monochrome, so the only colour on the map is yours. |
| Satellite | Aerial and satellite imagery, on its own. |
| Hybrid | The same imagery with roads, boundaries and place names drawn over it — usually what people mean when they say satellite. |
Vector themes are drawn from OpenStreetMap data via Protomaps; imagery comes from Esri World Imagery. The credits for the basemap, the terrain and any background layers are shown in the map's bottom-right corner automatically, on your public map and in embeds alike.
Custom map styles
When none of the seven fits — a brand palette, a print style, a deliberately quiet backdrop — build your own. Map styles are saved to your account and can be applied to any of your maps from the Style picker, so one style can carry a whole set of maps. Create and edit them under Settings → Custom Map Styles, with a full live map beside the editor.
| Tab | What you control |
|---|---|
| Colors | Around 45 individually settable colours: water, land, parks, woodland, scrub, sand, beach, glacier, buildings, hospitals, schools, industrial, airports, every road class and its casing, bridges, tunnels, boundaries, and every label and halo. |
| Roads | A width scale per group — highway, major, minor, railway, boundaries — plus whether roads get a casing and how thick it is. |
| Dashes | A dash pattern per line class: solid, dashed, dotted, long dash or dot-dash. This is what turns a boundary into a dotted line or a railway into a proper hatched track. |
| Labels | Halo width and blur, text size, letter spacing, label language, and the case and weight of each label group. |
| Fills | Tileable textures over parks (forest hatch, forest dots, park cross), water (wave) and beach (stipple), at an opacity you set. Useful for a hand-drawn or cartographic look. |
| Visibility | Independent zoom bands controlling when buildings, POIs, minor roads and labels appear at all — the most effective way to quieten a busy map — plus a checkbox per kind of point of interest across six families, so you can draw restaurants, cafés, shops, museums and theatres that the base map leaves switched off, or strip it back to just transit. Points of interest work on every base: White, Black and Grayscale ship no POI icons of their own, so theirs are borrowed from Light or Dark. |
Start a style from any of the five vector themes as a base, then override only what you need. Editing a saved style updates every map using it.
Map features
Four optional layers, toggled from the Map Features list in the Style button and available on any theme. They work together — terrain with a tilted pitch and contours makes a landscape map, buildings with terrain makes a city one, and points of interest give either its landmarks.
| Layer | What it adds |
|---|---|
| 3D terrain | Real elevation, so the ground has relief. Combined with automatic hillshading, tuned per theme so it reads on light and dark basemaps alike. Tilt the map to see it. |
| 3D buildings | Real building footprints extruded to their real heights, from the Overture Maps dataset. They appear from zoom 13, so tilt in over a built-up area to see them. |
| Contour lines | Elevation contours generated from the same terrain data, with the interval chosen for the zoom level, major and minor lines distinguished, and elevations labelled. |
| Points of interest | Parks, stations, schools and the rest of the basemap's places, each with its own icon. On by default for Light, Dark and Hybrid; switch it on for White, Black, Grayscale or Satellite. To add restaurants, cafés, shops and museums the basemap leaves off, pick them in a custom map style. |
Background layers
Every map type can render a published map service beneath your own data: aerial imagery, a cadastral layer, a scanned historical sheet, a soil or flood dataset. Nothing is imported — the tiles are fetched live from the publisher every time someone opens your map, so the layer stays current and none of it counts against your feature limit. Add one from the Layers button. On a Compare map each side keeps its own list, so you can put imagery behind one half and a reference layer behind the other.
The quickest way in is the Browse layers catalog: public layers we have checked work on any site and may be used on commercial maps, added with one click — no URL needed. Each one brings its own zoom range, coverage and credit.
| Catalog section | Examples |
|---|---|
| Imagery | Yesterday's satellite view of the planet (NASA MODIS and VIIRS), Sentinel-2 cloudless, Earth at night |
| Terrain & ocean | Global hillshade, US shaded relief and topo maps, ocean depth (GEBCO), European seabed |
| Water & environment | Surface water 1984–2021, tree cover loss, Corine land cover, vegetation, snow cover, US rivers |
| Weather & hazards | Live US weather radar, precipitation, sea surface temperature, smoke and dust |
| People & places | Population density, administrative boundaries, roads and places from Overture Maps |
| Outdoor & recreation | Hiking, cycling and mountain-bike routes, bike infrastructure, ski pistes, sea marks |
Daily layers show the most recent complete day, and catalog layers stay pointed at their publisher's current address without you doing anything. If you have a service of your own, use Paste a URL:
| Service | What to paste, and what happens |
|---|---|
| WMS | The service URL. Mapji reads its capabilities document and lists every layer it publishes so you can pick one or several. Versions 1.1.1 and 1.3.0 are both handled; projection, image format and tile size are worked out for you. |
| WMTS | The service or capabilities URL — how NASA, EOX and most national mapping agencies publish tiles. Pick one layer from the list; its zoom range, coverage and legend come with it. Only layers offered in Web Mercator are listed. |
| ArcGIS | A MapServer or ImageServer endpoint. A cached service is drawn straight from its tiles where the cache allows it and rendered on demand where it does not — either way you just paste the URL. |
| PMTiles | A single-file tile archive on ordinary storage — S3, R2, or any static host that serves byte ranges. Image archives draw as imagery; vector archives let you pick which of their layers to draw, up to eight, and in what colour. |
| XYZ tiles | Any standard {z}/{x}/{y} tile template, which covers most published raster tile sets and anything you host yourself. A template ending in .pbf or .mvt is read as vector tiles, and {-y} (TMS row order) is handled. |
| TileJSON | The URL of a TileJSON document, raster or vector. Your map reads it every time it loads, so a service that moves its tiles to a new build address keeps working. |
| Behaviour | Detail |
|---|---|
| How many | Up to 5 per map, or per Compare side |
| Stacking | Always beneath your own markers and shapes, and beneath the basemap's place names, so nothing you added disappears behind a backdrop |
| Adjusting | Rename, reorder, set opacity, and hide one temporarily without removing it. A layer's settings add the zoom range it shows at, brightness, contrast, saturation and hue, its legend where the publisher provides one, and its credit — none of which reloads the tiles |
| Vector archives | Auto-styled in one accent colour, with fills, outlines and points drawn correctly whatever the layer contains. A reference layer, not a second map editor. |
| Credits | Each layer's required attribution is added to the map's credit line automatically, on your public map and in embeds |
| Community-run layers | Marked in the catalog. They are run by volunteers and are fine for everyday maps; for very busy or commercial maps those projects ask that you host the tiles yourself |
Layer settings
Click a layer's name to rename it, and its sliders button to open its settings. Everything here previews on the map straight away and is kept when you press Save.
| Setting | What it does |
|---|---|
| Show at zoom | The zoom levels the layer appears at — a detailed layer only from street level, or a world-scale one only when zoomed out |
| Service's last level | For a service you connected: the deepest zoom it publishes. Beyond it the map enlarges its last tiles instead of asking for ones that don't exist. Catalog layers already know theirs |
| Brightness, contrast, saturation, hue | Knock imagery back so your data stands out, or turn it greyscale. Reset returns all four to the original |
| Legend | The publisher's legend, where it provides one — every WMS, WMTS and ArcGIS legend, and the catalog's climate and population layers |
| Credit | For a service you connected, the attribution text shown in the map's corner. Catalog layers bring their own |
Everything in the layer catalog
Each layer is fetched from its publisher every time your map loads. Layers marked community-run come from volunteer OpenStreetMap projects: fine for everyday maps, but those projects ask very busy or commercial sites to host the tiles themselves.
| Layer | Category | Coverage | Updated | Licence |
|---|---|---|---|---|
| Satellite — yesterday (MODIS) | Imagery | Global | Daily | NASA open data |
| Satellite — yesterday (VIIRS) | Imagery | Global | Daily | NASA open data |
| Sentinel-2 cloudless | Imagery | Global | 2016 | CC BY 4.0 |
| Earth at night | Imagery | Global | 2016 | NASA open data |
| Blue Marble with relief | Imagery | Global | Static | NASA open data |
| Hillshade | Terrain & ocean | Global | Static | NASA open data |
| US shaded relief | Terrain & ocean | United States | Static | Public domain (USGS) |
| US topographic map | Terrain & ocean | United States | Ongoing | Public domain (USGS) |
| Ocean depth (GEBCO) | Terrain & ocean | Global | Yearly | Public domain (GEBCO) |
| European seabed depth | Terrain & ocean | European seas | Yearly | CC BY 4.0 |
| Surface water | Water & environment | Global | 1984–2021 | Copernicus open data |
| Tree cover loss | Water & environment | Global | Yearly | CC BY 4.0 |
| Land cover (Corine) | Water & environment | Europe | 2018 | Copernicus open data |
| Vegetation (NDVI) | Water & environment | Global | Monthly | NASA open data |
| Snow cover | Water & environment | Global | Daily | NASA open data |
| US rivers and lakes | Water & environment | United States | Ongoing | Public domain (USGS) |
| US weather radar | Weather & hazards | Contiguous US | Live | Public domain (NOAA) |
| Precipitation | Weather & hazards | Global | Daily | NASA open data |
| Sea surface temperature | Weather & hazards | Global oceans | Daily | NASA open data |
| Smoke & dust | Weather & hazards | Global | Daily | NASA open data |
| Population density | People & places | Global | 2020 | CC BY 4.0 |
| Administrative boundaries | People & places | Global | Monthly | ODbL / CDLA |
| Roads and paths | People & places | Global | Monthly | ODbL / CDLA |
| Places | People & places | Global | Monthly | ODbL / CDLA |
| Hiking routescommunity-run | Outdoor & recreation | Global | Daily | CC BY-SA |
| Cycling routescommunity-run | Outdoor & recreation | Global | Daily | CC BY-SA |
| Mountain-bike routescommunity-run | Outdoor & recreation | Global | Daily | CC BY-SA |
| Bike infrastructurecommunity-run | Outdoor & recreation | Global | Daily | CC BY-SA |
| Ski pistescommunity-run | Outdoor & recreation | Global | Daily | CC BY-SA |
| Sea markscommunity-run | Outdoor & recreation | Global coasts | Daily | CC BY-SA |
| Coastlines | Reference | Global | Static | NASA open data |
Interactions
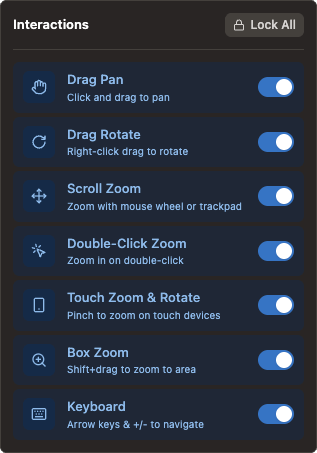
What visitors are allowed to do with the map. All seven are on by default, and they apply to the published map and to embeds — not just the editor preview. There is a Lock all / Unlock all switch for kiosk-style displays and static illustrations.
| Interaction | Effect | Default |
|---|---|---|
| Drag pan | Click and drag to move the map | On |
| Drag rotate | Right-click and drag to rotate and tilt | On |
| Scroll zoom | Zoom with the wheel or trackpad | On |
| Double-click zoom | Zoom in on double-click | On |
| Touch zoom & rotate | Pinch and twist on touch devices | On |
| Box zoom | Shift-drag to zoom to a rectangle | On |
| Keyboard | Arrow keys to pan, +/− to zoom | On |
Map widgets
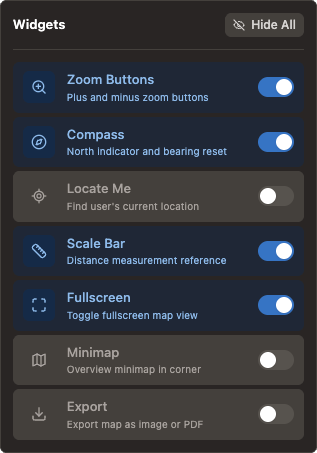
Which widgets appear on the published map. These also save with the site and apply to visitors, from the Widgets button on the map.
| Widget | What it does | Default |
|---|---|---|
| Zoom buttons | Plus and minus, top right | On |
| Compass | North indicator; click to reset bearing and pitch | On |
| Scale bar | A distance reference in the corner | On |
| Locate me | Centres on the visitor's location. Needs their permission, so it is off unless the map is about where they are. | Off |
| Fullscreen | Expands the map to fill the screen | Off |
| Minimap | A small overview map in the corner showing where the main view sits | Off |
| Export | Lets visitors download the current view as an image or a PDF | Off |
The export widget
Worth enabling when people will want to put your map in a report or a slide. It downloads exactly what is on screen, at print resolution.
| Option | Choices |
|---|---|
| Format | PNG, JPG, PDF or SVG |
| Resolution | 72, 96, 200, 300 or 400 DPI |
| Page size | Letter, A2 – A6, B2 – B6 |
| Orientation | Landscape or portrait |
Popups
Clicking a feature opens a popup. Until you change it, each map type shows its built-in one — a marker's name and description, a region's value, every column of a clustered point. Under Popup in the Settings tab you can design it instead: which column titles it, which rows it lists, in what order, under what label and in what format. A preview beside the settings shows the result for your real features as you edit — step through them with the arrows. Search results open the same popup.
Available on Draw, Cluster, Heatmap, Choropleth, Time Slider and Crowdsourced Map. Store Locator keeps its own location cards, set up under its display fields; Isochrone, Story Map and Compare show their own popups. On a Crowdsourced Map the popup is in the Display tab, offers only the fields you publish, and opens only when approved pins are shown with details. On a Draw map, clicking in the editor selects a feature, so use the preview.
| Format | Shows |
|---|---|
| Text | The value as written |
| Number | Thousands separators (switchable off); decimals automatic (up to 2) or fixed; optionally the short form, 1.2K / 3.4M |
| Currency | The currency's symbol from a three-letter code (EUR, USD, RSD…), with the same decimal and short-form options |
| Percent | The value as a percentage — 25 shows as 25%, or 0.25 does when the column holds fractions |
| Date | An ISO date (2024-03-15) written out; other date formats are shown as written |
| Link | A link that opens in a new tab — only for http(s) web addresses. Give it your own text, or show it as a button |
| Image | The picture at an http(s) image address |
| Email / Phone | A link that starts an email or a call, with optional text or a button |
Text and numbers can carry words before and after them — m², /night, approx. — spaced the way they read: 120 m², €90/night. Any row can hide its label. When you pick Customize, years, postcodes, ids, phone numbers and coordinates start as text, so they never gain thousands separators or lose a leading zero.
Photo, text, layout and hover
| Option | What it does |
|---|---|
| Photo at the top | A column holding an image address, shown across the top of the popup |
| Text | A short block under the title. {column} is replaced by that feature's value — in its row's format if the column has a row — and **bold** is bold. A line whose columns are all empty is left out, so "Built in {year}" disappears on a feature with no year |
| Layout | Label above value, or label beside value for a compact table |
| On hover | Nothing, a tooltip with the title, or the whole popup. A Choropleth shows its region and value by default. Touch screens have no hover; a tap opens the popup |
Directions and links to a feature
Directions adds a link on point features that opens Google Maps routed to the point — Apple Maps on an iPhone or iPad. Copy link copies a link to the map that opens with this feature's popup, zoomed in to it (on a Time Slider, the slider moves to its step). The link holds the map's address and nothing else from the page, so an embed's access token never travels with it. Embeds need the clipboard-write permission the embed code includes; an older embed shows the link selected for copying instead.
A drawn feature, a region and a Crowdsourced pin keep their own ids. On Cluster, Heatmap and Time Slider maps a feature is recognised by its location plus its id or name column, so a link survives a re-import or a re-sort of the data; one that moved or was renamed opens the map without a popup.
Rows with no value are skipped, and a value that doesn't fit its format — text in a currency column, a link that isn't a web address — is shown as plain text rather than guessed at. You can also switch popups off, or reset to the built-in popup. On a Time Slider, the popup fields you chose before this existed keep working until you customize the popup here.
Search & filters
A search and filter panel can be added to most map types, letting visitors search across the fields you choose and narrow the map with faceted filters. It searches your data — the columns you imported — not the world. It never looks addresses up, so a query matches feature properties rather than street addresses.
Available on Draw, Cluster, Heatmap, Choropleth, Time Slider, Isochrone and Crowdsourced Map. Store Locator is excluded because its sidebar has its own search, which matches every word in any field; Story Map and Compare do not offer it. On a Choropleth the region name and value are searchable as “Region” and “Value”; on an Isochrone the search covers your named starting points.
Filter types are inferred from your data
When you add a filter, Mapji reads the column and picks the control that fits it:
| Control | Chosen when |
|---|---|
| Range slider | More than 80% of the values are numeric |
| Dropdown | 10 or fewer distinct values |
| Multi-select | 11 to 30 distinct values |
| Not offered | More than 30 distinct values — a filter with that many options is a worse search box |
Comma-separated cells are split into separate values, so one row can match several options in a multi-select. That is what makes a “services offered” or “tags” column behave the way people expect.
Panel settings
| Setting | Options |
|---|---|
| Title and placeholder | Your own wording |
| Position | Any of the four map corners |
| Start collapsed | Useful on a small map where the panel would cover the data |
| Results list | Show matching features as a list. On by default. |
| Fly to matches | Move the map to fit what matched. On by default. |
| Highlight colour | How matched features are emphasised |
| Searchable fields | Specific columns, or all of them |
| Result label | Which column names each result; auto-detected if unset |
Configured under Search & filter in the Settings tab. Because it lives on the site rather than on the imported data, it stays reachable before you have imported anything.
Site settings
Four tabs, reached from Settings in the map editor.
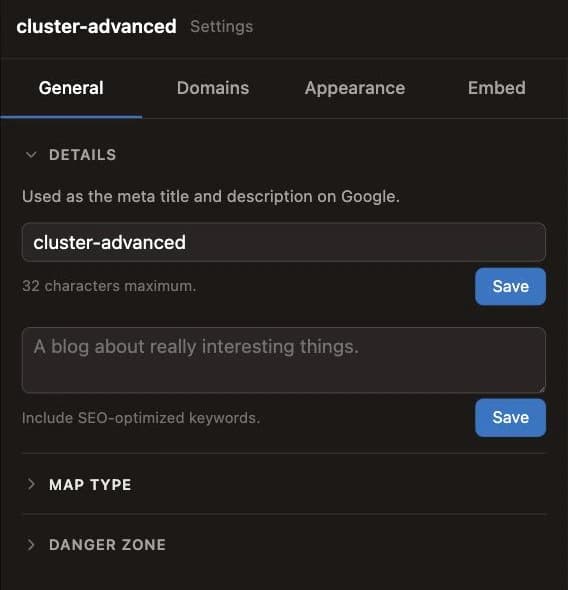
General
- Name — the map title, up to 32 characters. It is also the page title search engines show, so make it descriptive rather than internal.
- Description — the meta description on search results and link previews.
- Access — public, unlisted or password-protected; see below.
- Map type — switch between the ten types. Your features are kept; the type-specific configuration is not.
- Delete — removes the map and its data permanently.
Access
| Setting | Who can open the map |
|---|---|
| Public (the default) | Anyone with the link, and search engines can list it. |
| Unlisted | Anyone with the link. Its pages ask search engines not to index them, so it stays out of search results — but anyone you send the link to can pass it on. |
| Password | Only visitors who enter the password. Nothing of the map — its data, its style, even its name — is sent until they do, on every address and in embeds. |
A browser that has entered the password stays unlocked for 7 days. Changing the password locks everyone out until they enter the new one, and switching the map back to public or unlisted discards the password. While you are signed in you can open your own map without it on its mapji.com addresses; on a custom domain you enter it like anyone else. On a Crowdsourced Map, only visitors who have unlocked it can submit.
An embedded password map shows the password prompt inside the iframe. Safari blocks cookies in embedded frames, so a Safari visitor may be asked again on a later visit.
Domains
Every map is live at mapji.com/map/your-map from the moment it is created. That map address is generated from the name and can be changed here — letters, numbers and hyphens. Changing it moves the map, so existing links and embeds stop working.
A subdomain is optional. Add one here to serve the map at yourmap.mapji.com; while it is set, the /map address redirects to it, and removing it makes the /map address serve the map again. A short list of reserved names is unavailable.
To use your own domain, enter it and Mapji shows the DNS records to add at your registrar, then verifies them and issues an HTTPS certificate. An apex domain and a subdomain such as maps.yourbrand.com both work. Until verification completes the map keeps serving on its mapji.com address.
Appearance
This tab is about the page around the map, not the map style — for that see basemap themes.
| Setting | Detail |
|---|---|
| Social share image | The preview image used on link shares and in your dashboard. Until you upload one it is a screenshot of your map, kept up to date by the editor; once you upload your own, it stays. PNG or JPEG up to 10 MB, ideally 1200×630. |
| Browser tab icon | The small icon in the browser tab next to your map's name. A square PNG or JPEG up to 10 MB. |
Embed
Builds the iframe snippet — see Embedding.
Embedding
Every published map has a separate embed URL and a generated <iframe> snippet, built in the Embed tab of Settings. It works anywhere that accepts an HTML embed — a CMS, a blog post, a documentation site, a landing page.
| Option | Choices |
|---|---|
| Width | Full (100%) or a fixed pixel width. Full is almost always right — it lets your page decide how much room the map gets, and fixed widths break on phones. |
| Height | In pixels |
| Corner radius | 0, 4, 8, 16 or 24 px |
| Allow fullscreen | Adds the attribute the fullscreen widget needs to work inside an iframe |
| Auto-resize | Adds an optional listener script — see below |
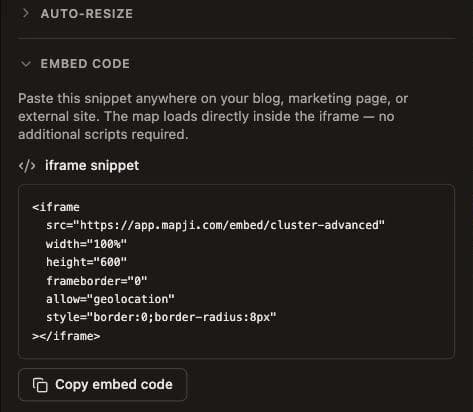
Auto-resizing the height
An iframe cannot work out how tall its contents want to be, so you either guess a height or use the listener script offered alongside the snippet. With it on the page, the embed reports its content height and the iframe resizes to match — which matters most for a Crowdsourced Map, where the form grows as validation messages appear. Add the script once per page: it matches each message to the iframe it came from, so a single copy handles every Mapji embed on the page, including two copies of the same map.
Behaviour inside an embed
Interaction and widget settings apply to embeds exactly as they do to the published map, so configure them with the embedding context in mind — see the note under Interactions about scroll zoom. A Crowdsourced Map accepts submissions from inside an embed; if you want it to accept them only there, set the allowed-origins list in its Rules tab.
Embeds and SEO
The embed URL is excluded from search engines on purpose, so it never competes with the page you put it on. Your published map — at its mapji.com/map address, subdomain or custom domain — stays crawlable, so link to it directly as well if you want the map itself to rank as a destination.