
"Heatmap" and "choropleth" get used interchangeably, and they answer completely different questions. Picking the wrong one doesn't just look odd — it produces a map that confidently states something your data doesn't support. Here's how to choose, and how to avoid the mistakes that make each one lie.
The short answer
- Use a heatmap when your data is individual points and you care about density — where things cluster.
- Use a choropleth when your data is aggregated by region and you care about comparing those regions — how a metric varies across states, countries, or counties.
The tell is in your spreadsheet. If each row has a latitude and a longitude, you have points. If each row has a region name and a number, you have regions. Your data usually decides this for you before taste gets involved.
What a heatmap shows
A heatmap takes raw points and blends them into a continuous color surface. It's great for spotting hotspots, but it deliberately blurs exact locations and has no notion of administrative boundaries. Two cities a mile apart will bleed together.
Two things to know before you build one:
Every point counts equally. The heat comes from how many points fall close
together, not from a value column. So a row per city with a visits column will
show you where your cities are, not where the visits are. Expand aggregated data
back to one row per occurrence, or use a choropleth instead.
Radius is doing more work than you think. It controls how far each point spreads, and it's the difference between a map of sharp hotspots and a single orange smear. It doesn't rescale as you zoom, so a radius tuned at city level looks wrong at country level. Set it at the zoom your readers will actually land on.
What a choropleth shows
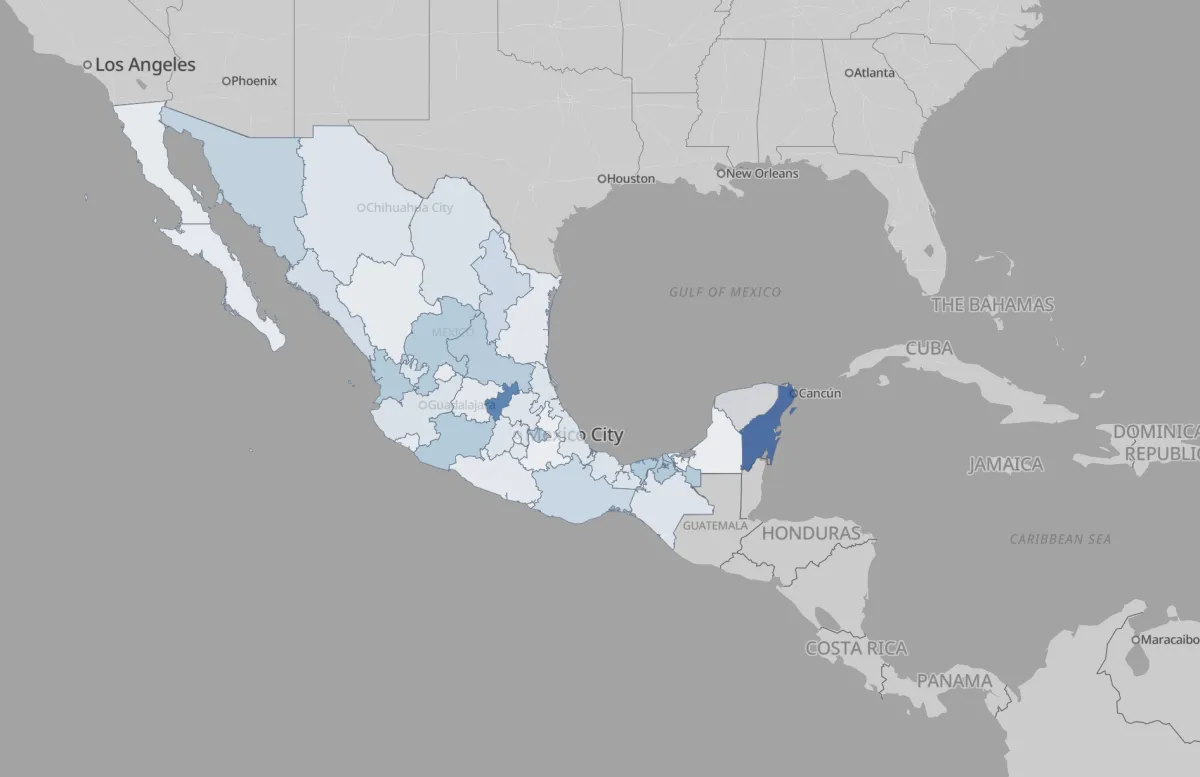
A choropleth map shades predefined regions by a value — for example coloring each state by population density. It's the right tool for demographic, economic, and election data because the regions are the unit of analysis.
Your input is different from a heatmap's: instead of coordinates, you supply a region name or code and a value per row. The boundaries come built in for countries, states and provinces, counties, and European NUTS regions, and your data is joined to them by name or standard code — so a column of state names, or of ISO codes, is enough.
The mistake each one invites
These are different mistakes, and both are common.
A choropleth shaded by raw count mostly shows you where the people are. Big or populous regions look important because they're big or populous, not because anything interesting is happening in them. A map of "total cases by state" is very close to a map of state population. Normalize: per capita, per square kilometer, per household — whatever makes the regions comparable. Rate, not count.
There's a visual version of the same problem: large, sparsely populated regions occupy far more pixels than dense urban ones, so a choropleth systematically over-weights empty land. Rural areas dominate the picture while the places where most of the data actually lives are small enough to miss.
A heatmap of too few points is a Rorschach test. Fifteen offices blurred into a gradient implies a smooth underlying surface that fifteen records cannot support, and readers will confidently interpret blobs that are really just individual pins wearing a costume. If you can count the points by eye, you want markers or a cluster map, not a heatmap. A few hundred points is a sensible floor; thousands is where heatmaps genuinely earn their place.
A quick decision guide
| Your data | Your question | Use |
|---|---|---|
| Points (events, stores, sensors) | Where is it dense? | Heatmap |
| Values per region | How do regions compare? | Choropleth |
| Points, but you want regional totals | Which region has more? | Aggregate, then choropleth |
| Points you need to click | What is each one? | Cluster map |
| Few points, hand-placed | Where are these? | Markers |
That third row is the one people miss. If you have points but your real question is regional, you don't have to choose between the two — count your points per region in the spreadsheet first, then map the totals as a choropleth. A pivot table is usually all it takes, and the resulting map answers the question far more directly than a heatmap that leaves readers estimating.
Try both
The fastest way to settle this is to see your data both ways. In Mapji you can build a heatmap and a choropleth from the same spreadsheet in a few minutes — no code required — and the right answer is usually obvious the moment they're side by side.
If neither fits, the problem is probably that individual records still matter, which is a cluster map question. The ten map types explained covers the full set.